A Brief Understanding of Information Visualization
This is my brief understanding of Information Visualization.
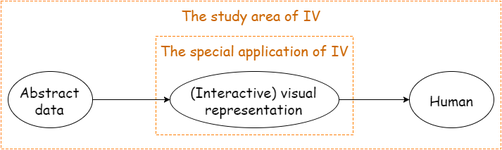
1. What is it?
Information Visualization (IV) is the study of (interactive) visual representations of abstract data to reinforce human cognition. (from Wikipedia) According to the definition, I created the following figure, which differentiated the special application and the study area of IV. For example, the study of human perception is not the special application of IV, but is very critical to this area since it can provide guidance for a better visualization design that can be effectively perceived by human.
2. Where is it in a bigger picture?
One way to answer this question is simply locate the area in a hierarchical classification system. According to the ACM Computing Classification System 2012, IV can be found here: Human-centered computing –> Visualization –> Visualization application domains –> Information visualization
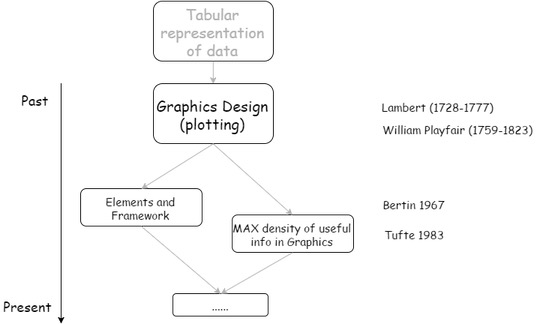
3. When/Why was it originated?
Its original motivation was to transit the tabular presentation of data into graphics. That was the start of the graphics design. J.H. Lambert and William Playfair were considered the inventors. Bertin and Tufte made fundamental contributions to the area. (from WikiViz) PS: People hold different opinions on the start time of VI. It can even be traced back to thousands of years. But I think the key point of this question is to know the motivation, which is to establish a better representation of information to solve people’s problems.
4. Where can it be applied?
- Scientific research
- Digital libraries
- Data mining
- Information graphics
- Financial data analysis
- Market studies
- Manufacturing production control
- Crime mapping
(from Wikipedia)
A few examples:
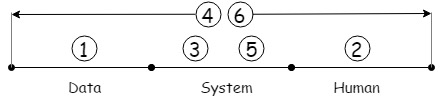
5. Where are we now?
According to the book Data Visualization from Ward et al., there are open issues of
- Data: scale; static vs. dynamic; spatial vs. non-spatial; nominal vs. ordinal; structured vs. nonstructured; time; variable quality.
- Cognition, Perception and Reasoning
- System Design
- Evaluation
- Hardware: Hand-held displays; display walls; immersive environments (to minimize latency); graphical processing units; interaction devices (e.g., sound input/output, tactile feedback, controllers in game, head/eye trackers, interactive tables).
- Applications: Depth-based innovations; breath-based innovations
I created a picture to illustrate where these issues stay within the pipeline of IV.